|
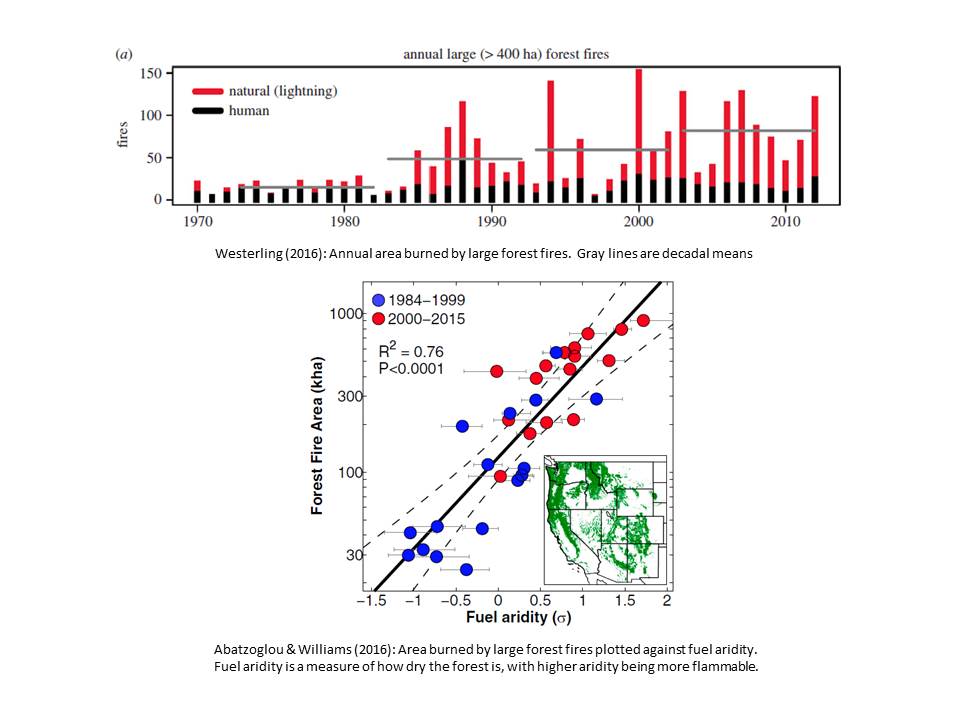
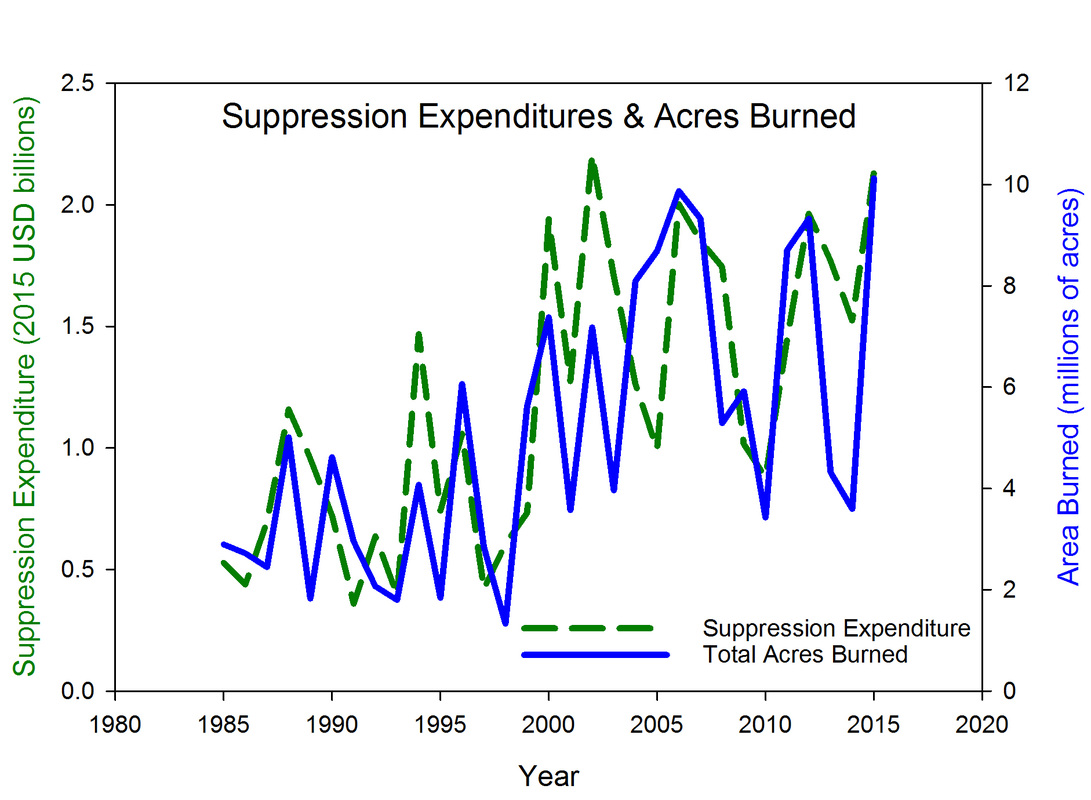
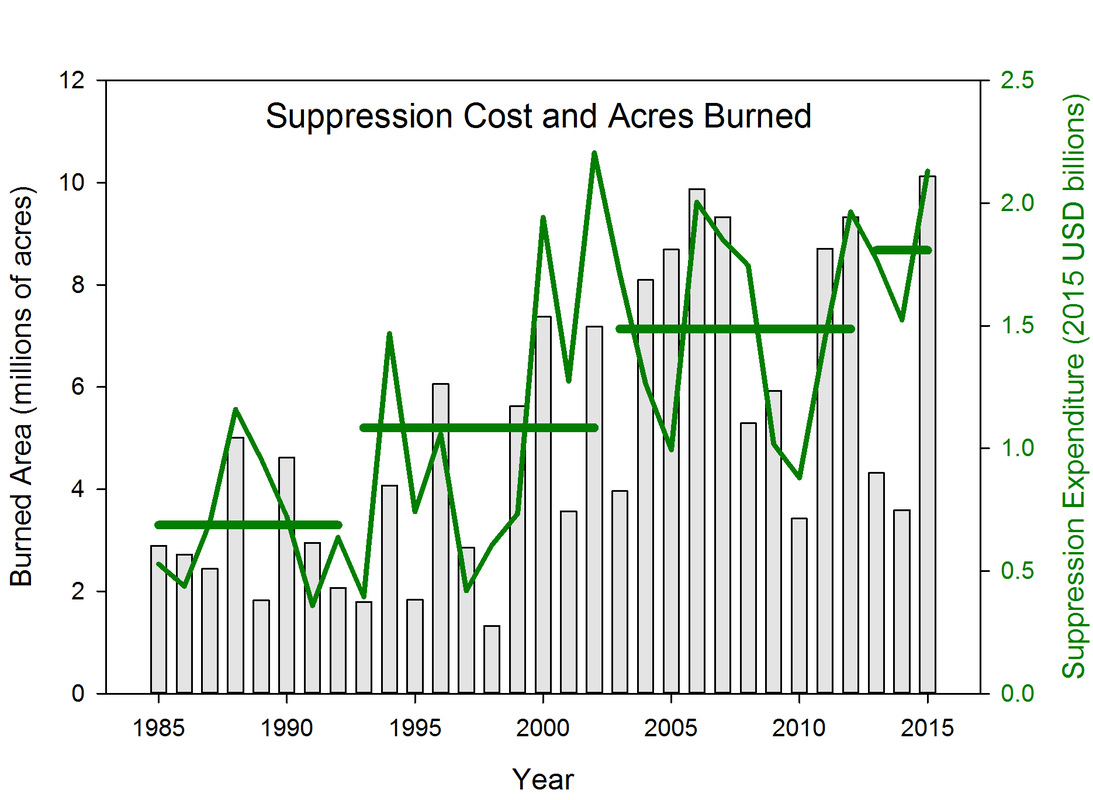
2016 has been an interesting year for wildfire research. A couple of studies published this year have identified linkages between the increasing area burned by wildfire and increasing temperature. Leroy Westerling published a study where he looked at the increase in area burned by large wildfires over the period 1970-2012. He found that across the western US, area burned by large wildfires has increased by 556% over the 1983-1992 average (Figure 1 top). His analysis shows that increasing temperatures correlate with longer fire seasons. Average fire season length increased by 84 days between the first decade of his analysis (1973-1982) and the last decade (2003-2012) John Abatzoglou and Park Williams published a study where they looked at the relationship between fuel aridity and area burned in the western US. Fuel aridity is a measure of how dry the material in the forest is and the drier it is the more flammable it is. Their results show a strong relationship between this measure of dryness and area burned (Figure 1 bottom). Increasing temperature is also playing a role here and they attribute approximately half of the forest area burned by wildfire to human-caused climate change over the period 1984-2015. Fire suppression costs by year from the National Interagency Fire Center website show that from 1985 to 2015 we spent approximately $36.6 billion on fire suppression in 2015 dollars. While the year with the highest total fire suppression cost was 2015 ($2.13 billion), the year with the highest per acre suppression cost was 1998 ($455/acre, Figure 2). Area burned in any particular year explains about 51% of the variability in suppression costs. A number of factors account for the remainder of the variability in suppression cost, including proximity to developed areas. As an example, the 2016 Soberanes fire in southern California burned 132,127 acres and cost an estimated $260 million to suppress, that works out to $1967/acre. When we look at how decadal averages in suppression cost have change over time, the picture is similar to Leroy Westerling’s results (Figure 3). It is important to note that the first average suppression cost only covers the period 1985-1992 and the last average suppression cost bar is only for the years 2013-2015. The majority of the suppression expenditures are by the US Forest Service and in a 2015 report they showed that fire suppression accounted for 52% of their budget. Given that area burned by wildfire in the western US is increasing as the temperature goes up and suppression expenditures are on the rise, this really begs the question – how sustainable is our current relationship with fire?
0 Comments
Your comment will be posted after it is approved.
Leave a Reply. |
Details
Archives
October 2023
Categories
All
|


 RSS Feed