|
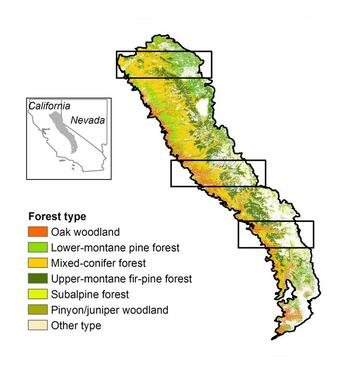
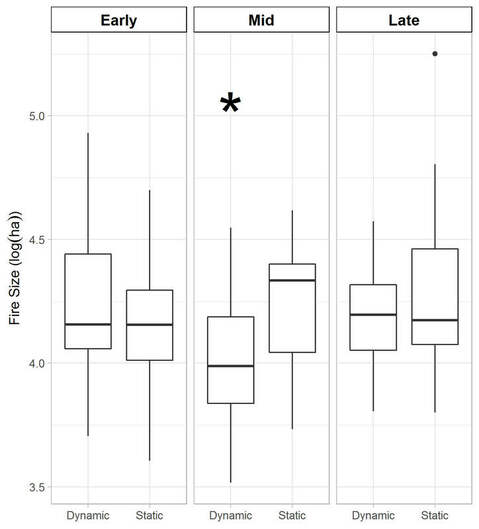
Across the western US, the area burned by wildfire has been increasing as a result of higher temperatures and earlier spring snowmelt. When temperature goes up, ecosystems dry out and become more available to burn. This relationship has formed the basis for projecting future area burned as a result of climate change. With the projected increase in area burned, the expectation is that wildfire emissions will also increase. In a prior study, we estimated a 19-101% increase in emissions from wildfires burning in California by the end of this century. However, the majority of fire projections, including our future work makes the assumption that there will be vegetation available to burn if a fire occurs. The problem with that assumption is that fire is a self-limiting process, meaning for some period of time after a wildfire occurs, there is not enough vegetation available to support another fire. Further, even if enough vegetation is present to support a second fire, the amount of vegetation may be lower than the first fire and result in fewer wildfire emissions. To determine the effects of prior wildfires on future wildfires, we modeled this vegetation-fire feedback by simulating forest growth and wildfire under future climate across three transects in the Sierra Nevada (Figure 1). We re-estimated wildfire size distributions at each decade from 2010-2100 to account for the effect of prior wildfires on future fire size. We used the area burned and the type of vegetation that it burned to estimate the emissions from wildfire. We found that when we accounted for the vegetation-fire feedback, the cumulative area burned was 9.8-21.8% lower than our simulations that only accounted for the effect of climate on wildfire (Figure 2). Scaled to the entire mountain range, this equals a 14.3% reducing in cumulative area burned through 2100. 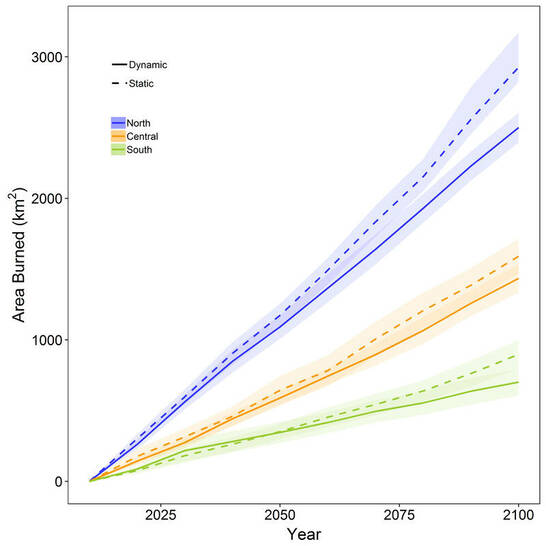 Figure 2: Cumulative area burned for the three transects in the Sierra Nevada under projected climate. The dynamics simulations (solid lines) account for the effects of prior fires limiting future fires and projected climate. The statics simulations (dashed lines) only account for projected climate. The largest wildfires are typically the most impactful to both society and ecosystems because large wildfires typically occur under extreme weather conditions, which cause them to spread rapidly. When we accounted for the effects of prior wildfires on fire size (dynamic), we found that by mid-century the largest wildfires were significantly smaller than the largest wildfires in the climate-only (static) simulations (Figure 3). However, by late-century, vegetation recovered in the previously burned areas and the largest wildfire sizes were no longer statistically different. The data in Figure 3 are plotted on a log-scale to meet the assumptions of the statistical test we used to compare them. By mid-century, the dynamic simulations had a median fire size of 24,053 acres and the static simulations had a median value of 53,389 acres. The biggest fire we simulated in the dynamic scenario occurred during early-century and was 210,452 acres. Whereas, in the static scenario, the biggest fire we simulated occurred in late-century and was 440,754 acres. For comparison, the 2013 Rim Fire burned 257,314 acres in the Sierra Nevada and estimated to have emitted the equivalent of 12 Tg of carbon dioxide, equivalent to 2.7% of California’s total emissions. When we calculated the emissions that our simulated wildfires would emit, we found that even when we account for the effects of previous wildfires limiting future wildfire size, total emissions in the Sierra Nevada are equivalent to one Rim Fire occurring every 3.8 years. This could have significant implications for air quality in California.
1 Comment
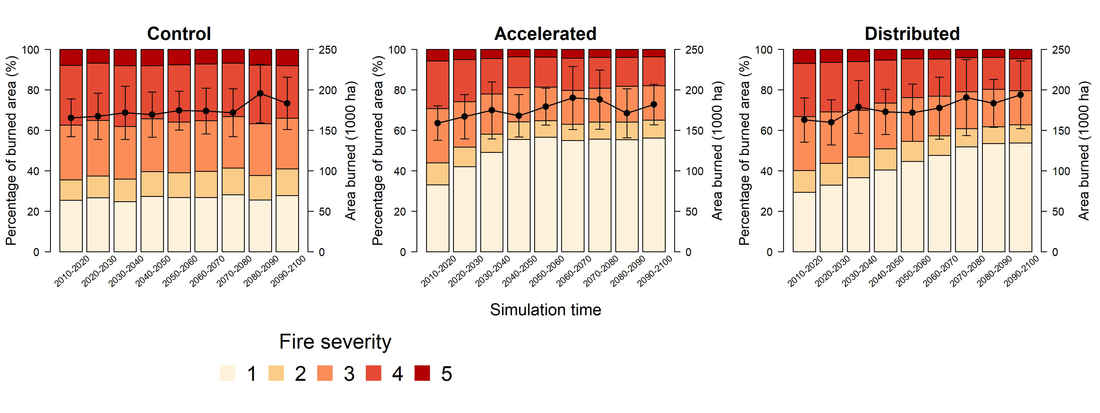
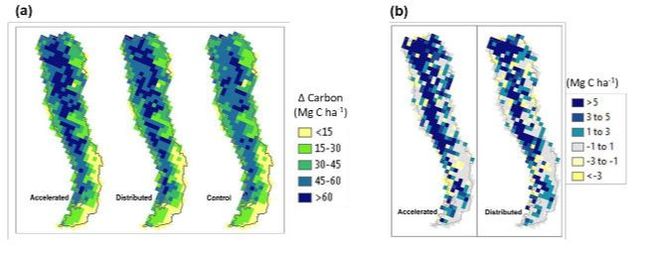
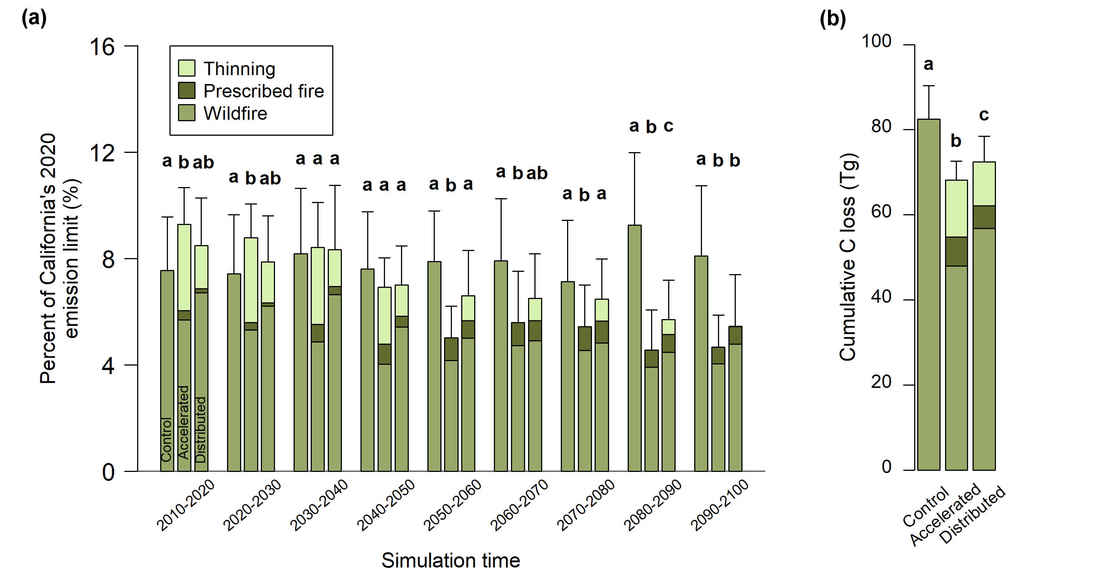
The area burned by wildfire in the Sierra Nevada has increased by 274% over the last 40 years and the area impacted by stand-replacing fire has also increased. The forests in the Sierra Nevada are important for provision of clean water and are also part of the state’s climate action plan. As a result, figuring out how to reduce the chances of large, hot fires presents a large challenge. We know that the current pace and scale of forest treatments to reduce the risk of large, hot fires is inadequate given the scale of the problem and the area burned by wildfire is projected to increase with on-going climate change. In a recent study led by Shuang Liang, we set out to determine how the pace of large-scale treatment implementation would alter carbon storage across the Sierra Nevada. We ran simulations under projected climate and wildfire and two management scenarios. Both management scenarios included applying thinning and prescribed burning treatments to low and mid-elevation forests. These are forests that have been most impacted by fire suppression. In the distributed scenario, we simulated an equal portion of the area treated at each time-step and with full treatment implementation by the end of this century. In the accelerated scenario, we simulated the same treatments over the same area, but schedule the treatments so they were complete by 2050. We included a control scenario that assumed no active management for comparison. The area burned between all three scenarios was fairly consistent because we used the same fire size distributions in our simulations (black line in Figure 1). However, the proportion of burned area that was burned by stand-replacing fire (severity 4 and 5) decreased substantially. The faster pace of treatment under the accelerated scenario increased the proportion of area burned by surface fire (severity 1 and 2) and decreased the area burned by stand-replacing fire at a much faster rate than the distributed scenario. Both the accelerated and distributed treatments ended up storing more carbon than the control by 2100 (Shown by the difference in Figure 2). However, what was most striking was how these treatments influence the carbon balance of Sierra Nevada forests as a percentage of California’s 2020 emissions limit from the Governor’s Climate Action Plan. Initially, total carbon losses are higher in the treatment scenarios, with the accelerated treatment having the largest loss (Figure 3). However by 2030, carbon loss is similar amongst all three scenarios and by 2050 the accelerated scenario has lower emissions than the wildfire emissions under the control. As we demonstrated in a previous study, changing climate and the increase in area burned has the potential to increase wildfire emissions by 19-101% by later this century. The results from this study demonstrate that restoring surface fires to the low and mid-elevation forests in the Sierra Nevada can reduce the magnitude of future emissions and maintain a larger amount of carbon stored in these forests.
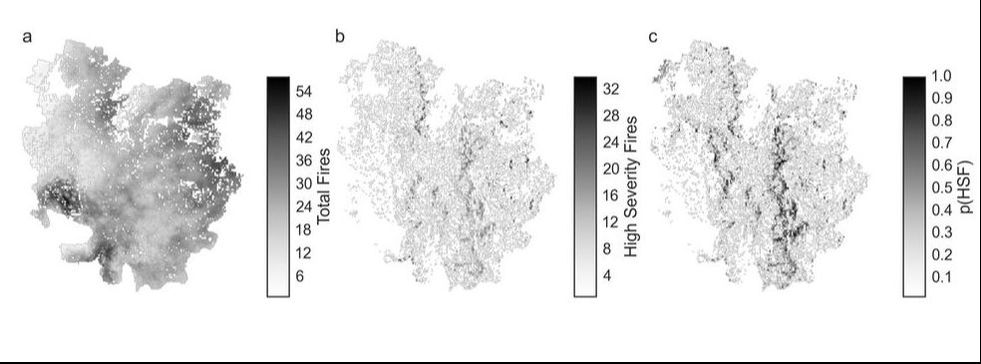
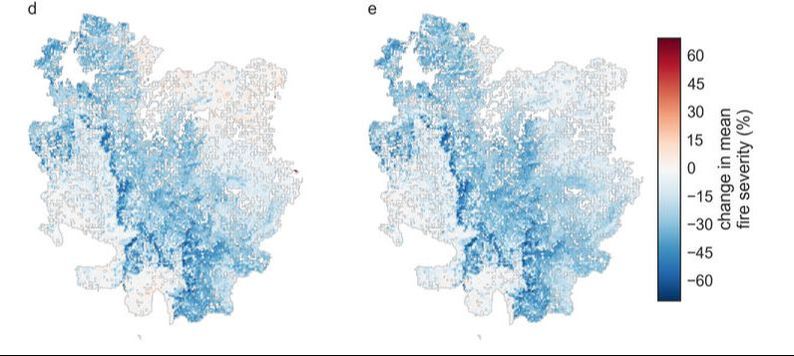
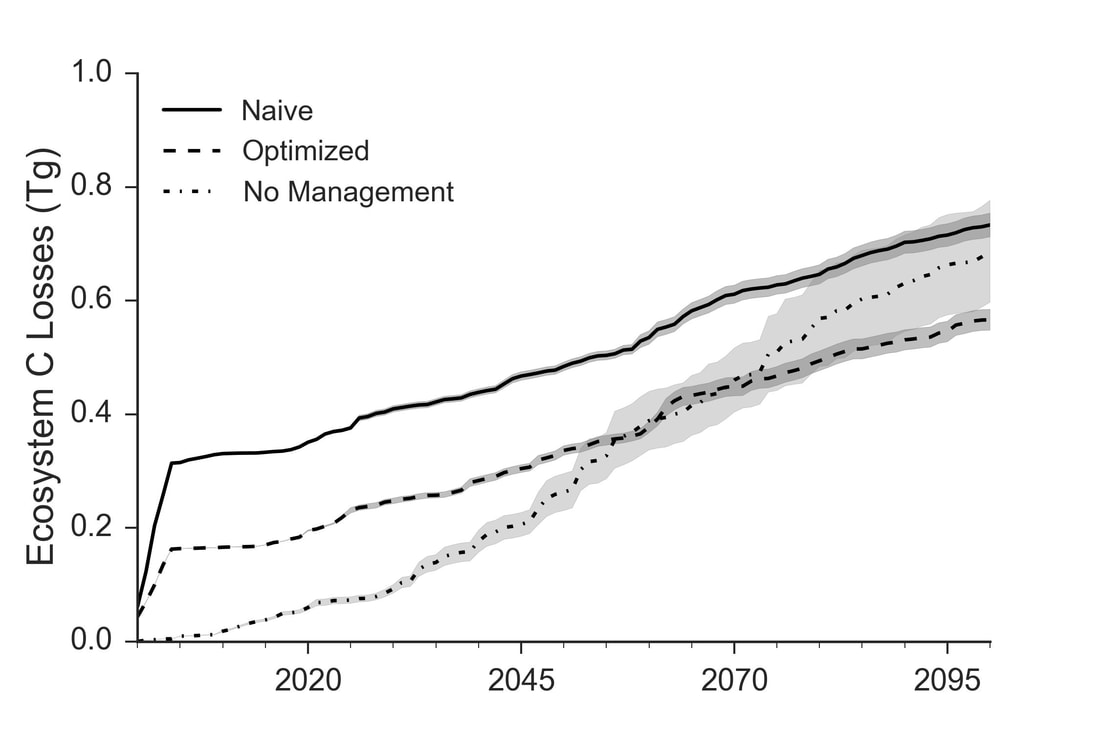
Over a series of studies we have evaluated the carbon tradeoffs associated with treatments to reduce the risk of large, hot wildfires. In a 2008 study we posited that since large, hot wildfires release a considerable amount of carbon to the atmosphere because they kill trees and combust more plant material, thinning smaller trees and restoring surface fire would result in a net carbon benefit. The basis for this argument is that while thinning and prescribed burning both remove and release carbon from the ecosystem, the total carbon loss will be lower over time because when wildfire does occur the effects on the treated forest will be lower. One of the arguments against this line of thought was presented by John Campbell and colleagues in a 2012 paper. They argued that since we cannot predict exactly where fires will occur, more area will be treated than will burn in a wildfire and the net effect will be lower overall carbon storage. Building on our previous work where we looked at the effects of increasingly severe fire weather, we sought to determine if we could use our understanding of where fires are likely be hottest and kill the most trees to inform the placement of thinning treatments. In a recent study led by Dan Krofcheck, we ran simulations of the same Dinkey Creek watershed in the Sierra Nevada using projected climate data from four different climate models and projected fire weather. We used the simulations from the first Dinkey Creek study to identify the locations on the landscape that had the largest chance of being burned by hot, tree-killing fire. We then ran simulations where we thinned every location on the landscape that was legally and operationally available, meaning that these areas were not protected by law and the ground was not too steep to prevent thinning equipment from working. We called this the naïve scenario because it assumes that no prior information exists about where best to locate treatments. In reality, that is not how treatments are located. Forest managers use all kinds of information to inform the location of their treatments. In the optimized case, we only thinned areas of the landscape where there was a higher chance of stand-replacing fire. Importantly, we simulated prescribed fire to all forests where it is ecologically appropriate in both scenarios. The results show that in terms of reducing the chance of stand-replacing fire, both scenarios performed almost exactly the same. In areas where the chance of high severity fire is high, both the naïve and optimized scenarios had the same reduction in fire severity when compared to the no-management scenario. Both management scenarios also reduced the variability in carbon loss from the system because there were fewer stand-replacing fires. However, because we only thinned the highest risk places in the optimized scenario, we ended up thinning approximately 60% less area than in the naïve scenario. This resulted in much lower carbon loss from the system at the beginning of the simulations and an overall lower total carbon loss than both the no-management and naïve scenarios. This research demonstrates that if we inform our treatment locations based on where we have the highest risk of stand-replacing fire, we can treat much less of the landscape with thinning and reduce both carbon loss from treatment and carbon loss from wildfire.
|
Details
Archives
October 2023
Categories
All
|
 RSS Feed