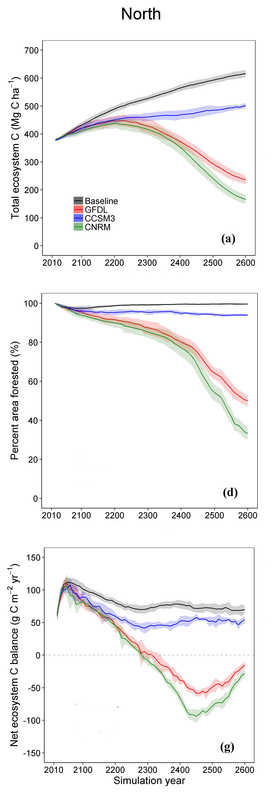
 The carbon carrying capacity of an ecosystem is the maximum amount of carbon that can be sustained in a given location on the planet under prevailing climate and natural disturbance conditions. The idea is that given the temperature range and amount of precipitation at a given location, there are only certain types of plant species that can grow there. This is exactly why we don’t see giant sequoia trees growing next to Joshua trees in the Mojave desert. rests in the Sierra are heavily dependent on the winter snowpack for providing growing season moisture. Under a moderate-high emission scenario, the snowline elevation is projected to increase by about 200 meters (650 feet) of elevation over the next 100 years. Now, as any geographer will tell you when you go up in elevation there is less land area. This increasing snowline elevation means there will be considerably less area that maintains a snowpack to provide water during the growing season. In a recent paper led by Shuang Liang, we ran simulations of forests of the Sierra Nevada under projected climate change and wildfire. We used climate projects from three climate models and area burned projections from Leroy Westerling. We ran our simulations out over several hundred years and assumed that the climate beyond the year 2100 would be similar to the climate projected for 2090-2100. These long simulation times allowed us to evaluate the effects of altered climate on the carbon carrying capacity of currently forested areas in the Sierra Nevada. Our simulations show that with increased warming and drying and more area burned by wildfire that the amount of carbon these ecosystems can sustain will decrease by as much as 73% (top panel). A big part of that reduction is due to as much as a 65% reduction in forested area (middle panel). The loss of forest cover is driven by fewer species of tree seedlings being able to establish in these future conditions, especially after more area is burned by wildfire. As the figure shows, there is quite a bit of variability between the different climate model projections. The GFDL (red) and CNRM (green) models show a large decline in both carbon and forested area, whereas the CCSM3 (blue) climate model shows both carbon and forested area holding pretty steady. The loss of forest cover leads to the carbon flux results in the bottom panel. The bottom panel shows the net ecosystem carbon balance. When the values are positive, the forests are removing carbon from the atmosphere and when the values are negative, the forests are a source of carbon to the atmosphere. Under two of the climate model projections, Sierran forests become sources of carbon to the atmosphere and will be another thing we have to consider when thinking about mitigating climate change. The big question is – what can we do about the prospect of having 50% of the forested area converting to something other than forest? Reducing our greenhouse gas emissions to the atmosphere is the logical place to start, but since this blog is about forest ecology research you will have to stay tuned for the results of our current work that is looking at the role of management in reducing the risk of forest cover loss to climate change and wildfire.
0 Comments
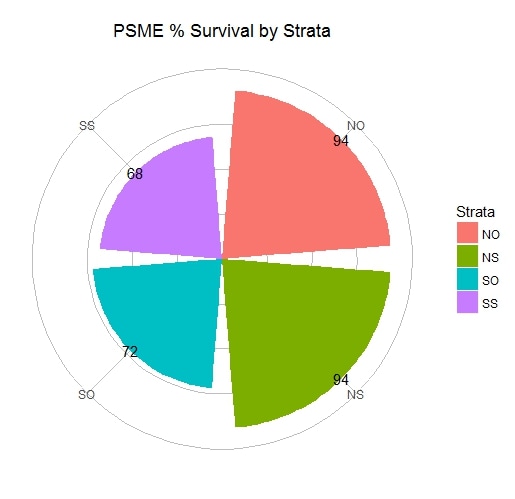
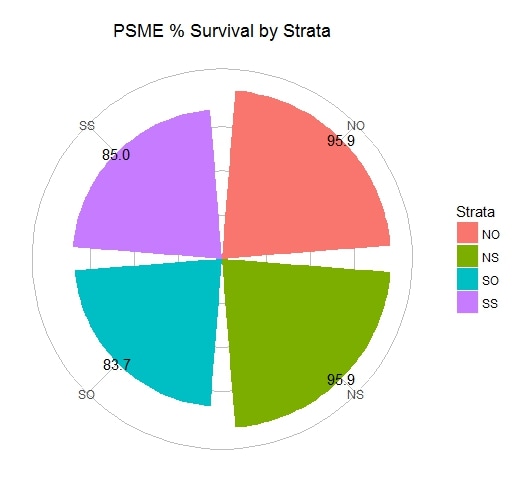
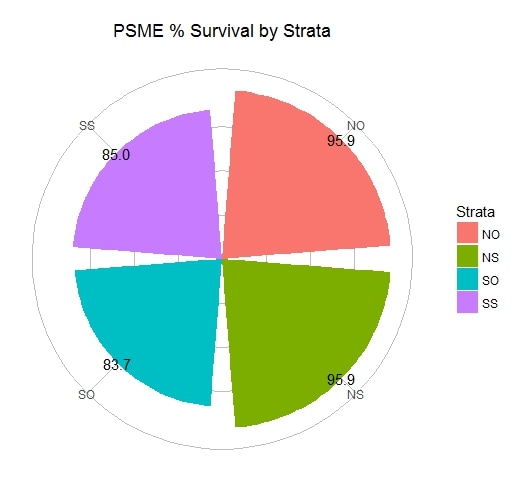
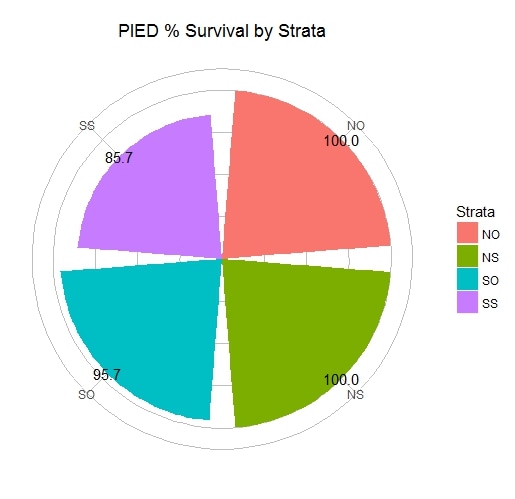
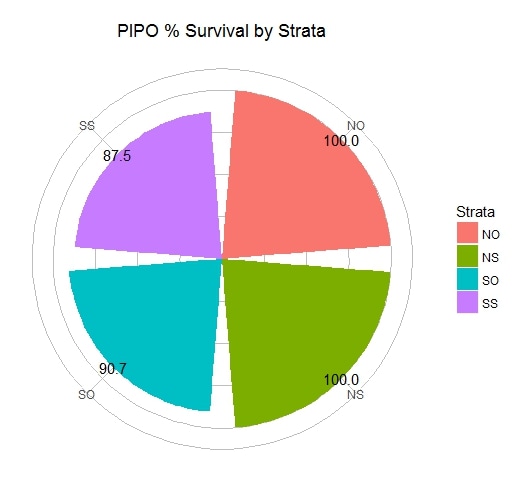
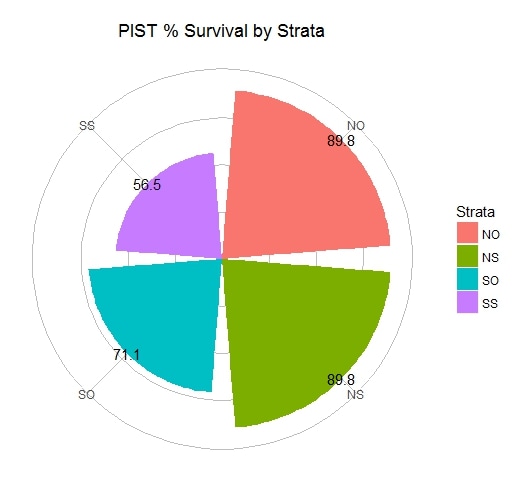
We were out on 18 April 2017 to conduct a post-snow melt, pre-dry season seedling survival survey on our plots in the Jemez Mountains. You can read more about the overall project here, but a quick recap: We planted seedlings from four species stratified based on aspect (north, south) and cover (shrub, no-shrub) this past fall in the footprint of the 2011 Las Conchas Fire. We found that our elk deterrent fencing was inadequate in a few areas and that mmmm, soil moisture and temperature sensor wires sure do look tasty to an elk. S.H. Hurlbert in his classic 1984 paper on pseudoreplication states that replication controls for, among other things, “non-demonic intrusion”. He then goes on to state “If you worked in areas inhabited by demons you would be in trouble regardless of the perfection of your experimental designs. If a demon chose to “do something” to each experimental unit in treatment A but to no experimental unit in treatment B, and if his/her/its visit went undetected, the results would be misleading.” Further in the same paragraph he states “Whether such non-malevolent entities are regarded as demons or whether on simply attributes the problem to the experimenter’s lack of foresight and inadequacy of procedural controls is a subjective matter.” I guess in the case of our planted seedlings, we foresaw the potential for elk to eat our seedlings and therefore exhibited some experimental foresight. However, we didn’t foresee the appeal of sensor cables to elk. Either way, it looks like we’ve got a case of “non-demonic intrusion” and a case of “demonic intrusion”. Fortunately, it is pretty clear when an elk decides to either eat the tasty seedling treat or just ripped it out of the ground and we can look at the effect of including this information or excluding it in a summary presentation of the information. Even though I still don’t have any resolution regarding whether or not elk qualify as demons, we can at least look at initial survival of the four different seedling species. The labels are as follows: PSME = Douglas-fir, PIPO = ponderosa pine, PIED = pinyon pine, and PIST = southwestern white pine. The strata are labeled as follows: NO = north aspect without shrubs, NS = north aspect with shrubs, SO = south aspect without shrubs, and SS = south aspect with shrubs. We had higher percent survival on north aspects for all species and lower percent survival on south aspects. Southwestern white pine (PIST) seemed to have an especially tough time on south aspects, as compared to the other species.
One of our hypotheses for this project is that seedlings will have higher survival on north aspects than on south aspects and that on south aspects, survival will be higher with shrubs than without. We’ll see how this plays out during the May-June dry period. So, stay tuned for the next post where we’ll also have some temperature and relative humidity data by strata as well. |
Details
Archives
October 2023
Categories
All
|


 RSS Feed