|
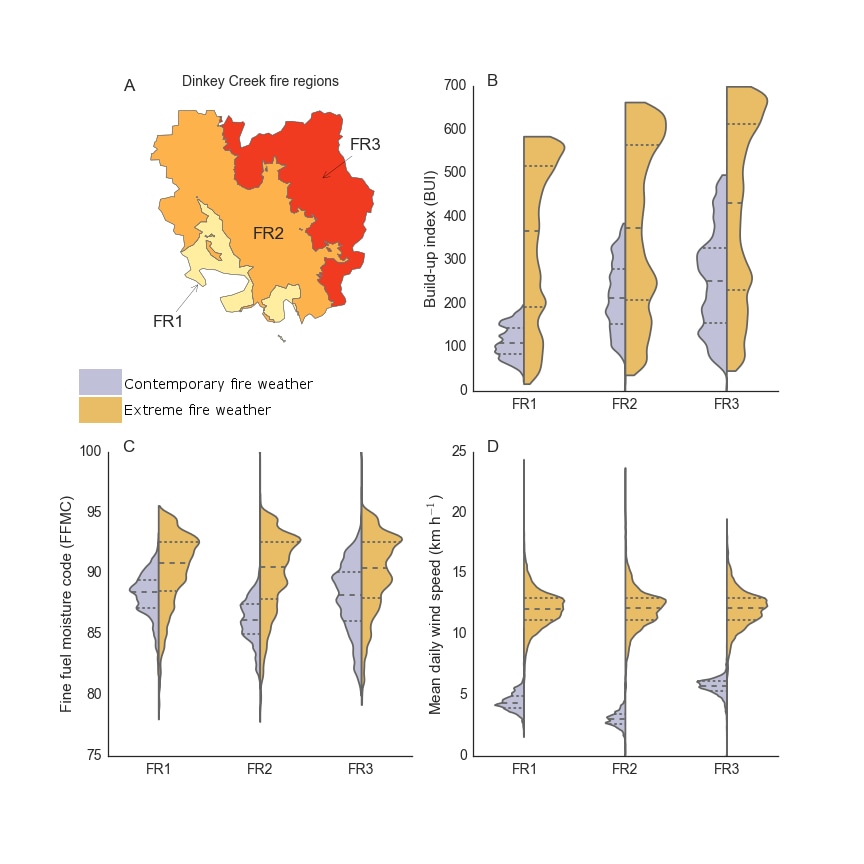
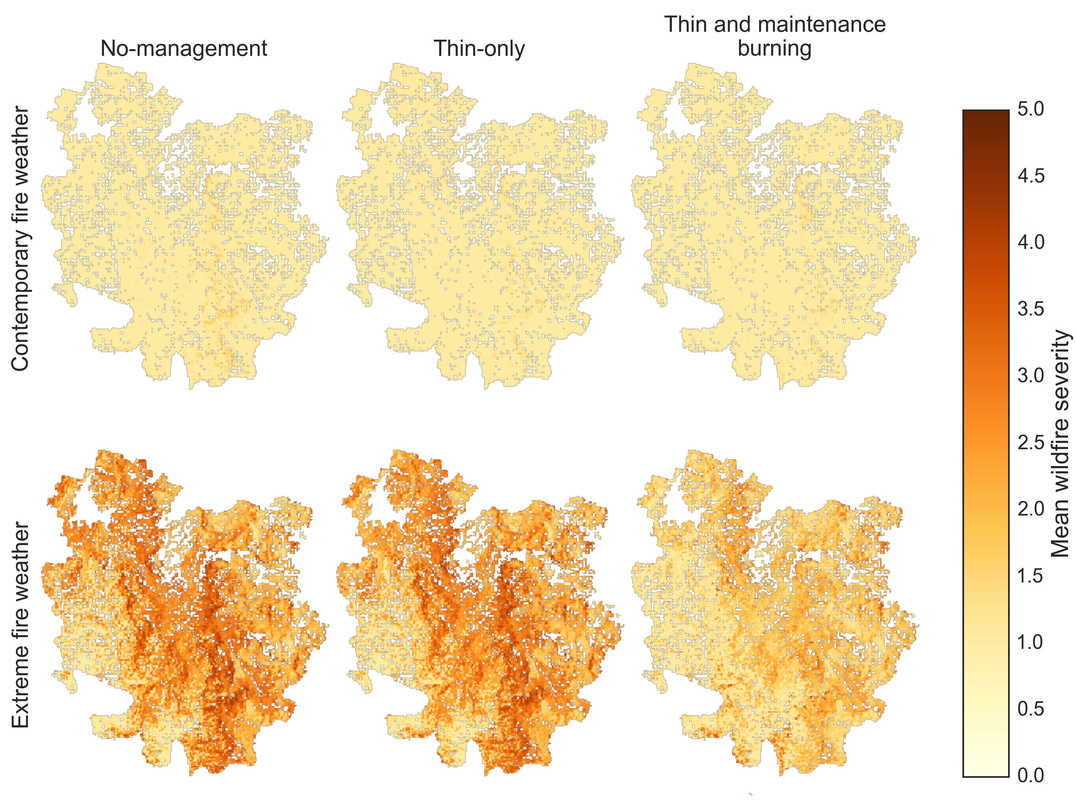
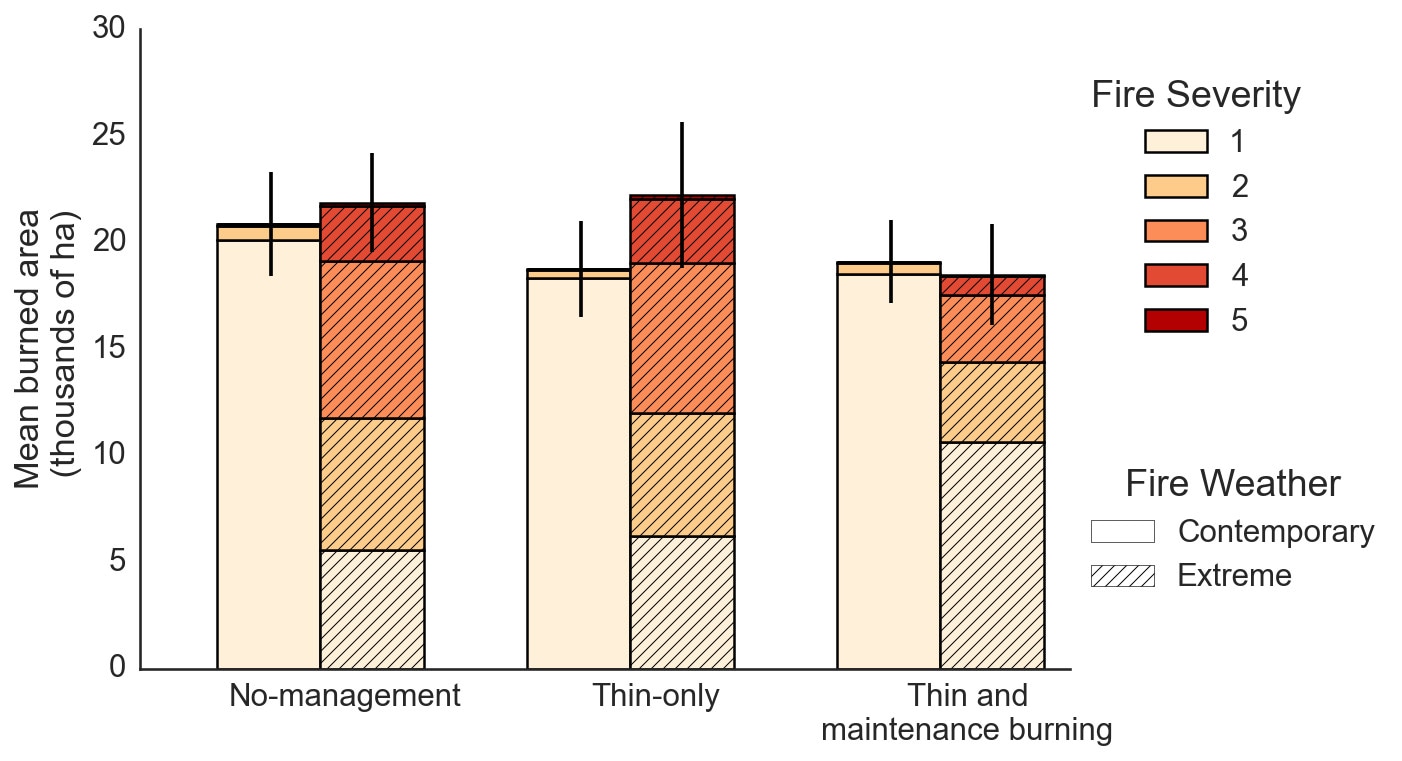
The fire triangle (oxygen, heat, fuel) applies to wildland fire as much as it does to any other type of fire. Fire suppression involves “removing” one of the legs of the triangle, usually fuel. The fire behavior triangle (fuels, topography, weather) influences how fire behaves when burning through a forest. Things like steep slopes, high temperatures, and gusty winds can all cause more active fire behavior. In a recent paper, Brandon Collins analyzed 40 years of weather data in the northern Sierra Nevada. He found that the frequency of extreme fire weather (hotter, drier, and windier conditions) has increased. We tend to get our largest and hottest wildfires under extreme fire weather. In a recent paper led by Dan Krofcheck, we set out to better understand how extreme fire weather influences the effects of forest treatments on moderating fire behavior (i.e. surface fire rather than crown fire) in the Dinkey Creek watershed in the southern Sierra Nevada. Since we wanted to isolate the effects of fire weather, we created two different sets of fire weather inputs. The first was generated using 13 years of data from three different weather stations located in or near the Dinkey Creek watershed. The second set of weather was generated using weather station data from the 2013 Rim Fire, which burned 141,131 ha of the Stanislaus National Forest and Yosemite National Park. The figure below shows the differences in model inputs generated from these two different sets of weather data. The distributions from the 13 years of weather data (labeled contemporary) have a lower build-up index (panel B) and fine fuel moisture code (panel C), which are measures of how much moisture is in the fuel and lower values mean the fuel is wetter and less available to burn. While these two parameters both had fairly big differences, the biggest difference was in mean daily wind speed (panel D). The weather station near the Rim Fire (labeled extreme) recorded much higher daily wind speeds than we see in the contemporary data. We ran simulations with no management activities, thinning, and thinning followed by regular prescribed burning under both distributions of weather. Under contemporary fire weather, we didn’t find a big difference between the management scenarios in terms of fire severity (0 = no fire; 5 = tree-killing fire). When we ran the same management scenarios with the extreme fire weather, the results were quite striking (Figure 2). The no-management and thin-only scenarios both had large increases in fire severity across the majority of the watershed (Figure 3). We also found increasing fire severity under the thin and maintenance burning scenario, but across the majority of the watershed, severity was considerably lower with regular prescribed fire use. When we looked at the variability in fire severity between model runs for a particular management scenario we found that the no-management and thin-only scenarios consistently burned more severely. The most interesting finding for us was the large difference between the thin-only and thin and maintenance burning treatments. The increase in fire severity for the thin-only treatment was driven by the big increase in shrub growth that occurred following thinning. Opening up the canopy allows more light to reach the forest floor and shrubs are able to grow in more continuous patches that carry fire. When we followed the thinning with regular prescribed fire, the repeated surface fire held the shrubs in check and reduced the fuel available to carry fire. As fire weather continues to become more extreme with changing climate, our results suggest that restoring surface fire is central to reducing the chance of high severity, tree-killing wildfire.
0 Comments
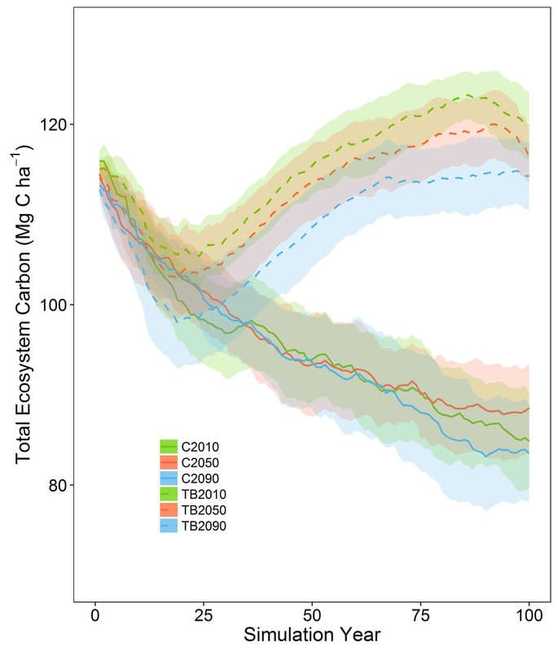
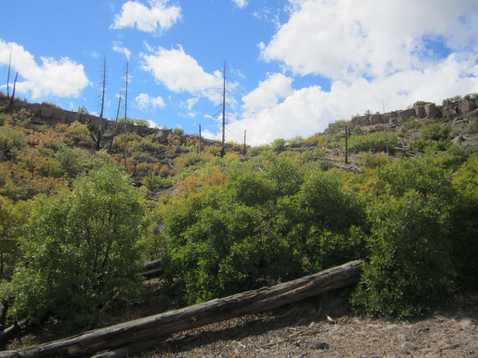
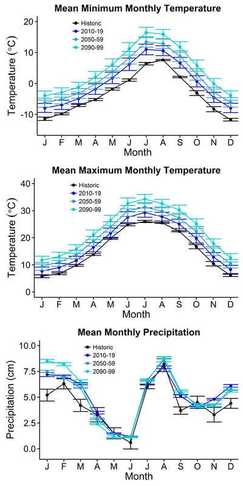 In a previous study we looked at the effects of forest treatments to restore surface fire and how they influence forest carbon storage. That study used historical climate to grow the forests, which left me wondering if how carbon dynamics and the influence of restoring surface fires might be altered by changing climate. To answer this question, I used the same forest landscape model as the previous study and obtained projected climate data from the climate models that were run in support of the IPCC’s Fifth Assessment Report. Using all of these climate projections, I developed monthly climate distributions for early, middle, and late 21st century. As the figure on the right shows, each period is progressively warmer and the amount of precipitation falling each month is quite variable. The figure below shows the influence of climate change and wildfire without treatments to restore surface fire (solid lines) and with treatments to restore surface fire (dotted lines). Without treatments, the combination of tree-killing wildfire and warmer temperatures cause the amount of carbon stored in ponderosa pine trees to decline over time. With treatments, the amount of carbon initially decreases because of the removal of trees by thinning and then increases over time. This is because fewer ponderosa pine trees are killed when wildfire occurs. The treatment simulations (dashed lines) also show how climate affects tree growth. The blue line and shaded area represents carbon under late-century climate (2090-2099) and it is significantly lower than under early-century climate (2010-2019). Interestingly, the results from simulations that don’t include treatments are heavily influenced by a large increase in Gambel oak. This species can resprout after fire and provide a fuel source to carry a subsequent fire before the pine trees are large enough to withstand fire. As shown in the photos below, this is an outcome that we are already seeing in the southwestern US following large, hot wildfires. The results from this study suggest that by restoring natural fires to this ponderosa pine forest, we can maintain a pine forest for a longer period of time under changing climate.
|
Details
Archives
October 2023
Categories
All
|

 RSS Feed