|
Imagine a career where a high success rate means you fail more than 50% of the time and you can never prove you are correct. That is being a scientist.
I live in a world where the majority of my friends are also scientists and I often forget that most people have relatively limited formal exposure to science. Sure, you take biology and chemistry in high school and if you’re not a science major in college, you take a few science classes. What gets lost in this level of education is how messy the scientific process is and how often you fail to accomplish your objective. What also gets lost is how the excitement of unexpected results is really what drives most of us. We teach science as a linear process in introductory science classes – researcher develops hypothesis, designs experiment to test hypothesis, experiment supports hypothesis, new knowledge acquired and added to text book. But, that isn’t how it really works. A more accurate representation of this bland description is that – researcher develops hypothesis, designs experiment to test hypothesis, experiment fails for any number of reasons, researcher develops new experiment to test hypothesis, experiment inconclusive, new knowledge acquired, researcher reevaluates hypothesis and starts over. Of course, that doesn’t do the process justice. In my experience as a forest ecologist it usually goes something like this:
If you’re not a scientist (which I hope) and reading this (the whole reason I write this blog), you’re probably thinking – This poor science geek can only make friends with other scientists. and It must be pretty demoralizing to fail most of the time. I certainly can’t speak for everyone in science, but I’m pretty obsessive when it comes to thinking about forests and most of my friends are pretty obsessive about thinking about their study systems too. It’s not a curse; nature is a fascinatingly complex puzzle. I absolutely love forests and I strive to do meaningful work that helps us understand and better manage our forests. As for the failure part, sure sometimes it’s disheartening. But the unexpected is what motivates me. When I get unexpected results and it challenges me to think about the forest in a new way, that is what wakes me up in the middle of the night. That is what allows me to let the grant proposal and paper rejections roll off my back. When I teach introductory ecology, I try and communicate to students that this process is not linear like their textbook would have them believe. The information that makes it into a book has lots of failure and reevaluation behind it. The individuals that discovered those things in their textbook were driven by curiosity and the desire to more completely understand whatever system they were working in. While this career certainly doesn’t appeal to most, I just hope that people who aren’t scientists can appreciate the process the way I appreciate the process an artist or business person or engineer goes through.
0 Comments
This has been a big year for wildfires so far and an especially impactful year for some communities that have been devastated by fire. Several of us were keeping an eye on the Rough Fire as it looked like it was going to cross the north fork of the Kings River and head to the Teakettle Experimental Forest. In addition to media coverage of big wildfire events has been heightened attention to the rising costs of fire suppression and the ever larger fraction of US Forest Service budgets that suppression is consuming. The news reports, the Rough Fire, and the focus on suppression costs caused me to take a look at some fire figures for the past decade posted on the National Interagency Fire Center (NIFC) website. So far, 2015 is second only to 2006 for number of acres burned and the 2015 fire season isn’t over yet. From 2005-2015, total acres burned ranged from 2.9 million acres in 2010 to 9.03 million acres in 2006. During this 10 year period we averaged 58,195 fires per year and we spent between $984 million and $1.92 billion fighting the fires. In the table below I have pulled the yearly fire data from the NIFC website and made a couple of calculations. 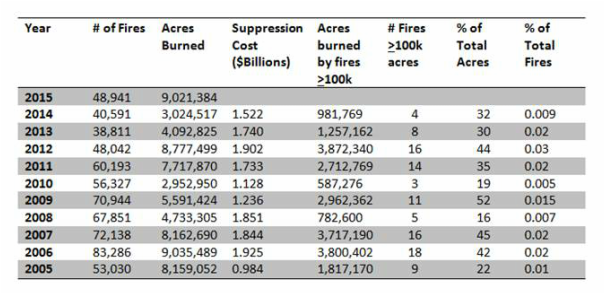 You might think that there is a relationship between the number of fires and the number of acres burned in a given year. However, the number of fires only accounts for about 12% of the variability in number of acres burned each year. As it turns out, the number of fires 100,000 acres or larger in a given year explains much more of the variability in acres burned each year. 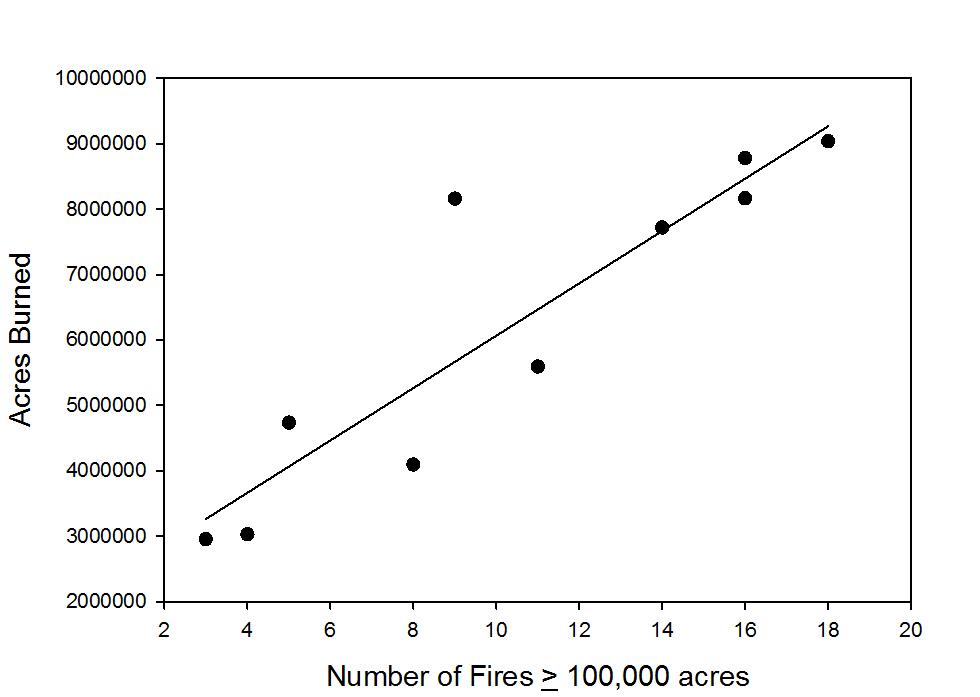 The number of fires 100,000 acres or larger accounts for 81% of the variability in acres burned in a given year from 2005 to 2014. These larger fires account for between 16% and 45% of the acres burned over this time period and only 0.009 to 0.03% of the number of fires. These so-called megafires have accounted for a large fraction of the area burned this year.
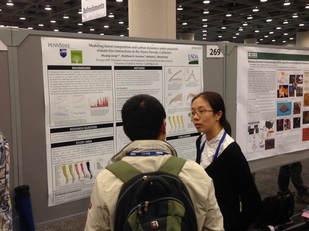
The number of large wildfires in the western US have been increasing since the mid-1980s and are correlated with warmer temperature and earlier spring snowmelt. The National Research Council estimated that each degree Celsius of additional warming will increase the area burned by 200-400% in parts of the western US. Recent work has argued that we need to reevaluate the way we manage fire and fund wildfire suppression efforts. These ideas are especially salient considering that as the climate warms further, we can expect more large wildfires, which will not only impact communities where wildfires burn, but also impact communities that are further away with degraded air quality. With over 23,000 posters and presentations at the 2014 Fall Meeting of the American Geophysical Union, there was tons of interesting research to learn about. Danelle Laflower and Shuang Liang gave posters in the session entitled Forests under a changing climate: uncertainties, carbon management, and adaptation. 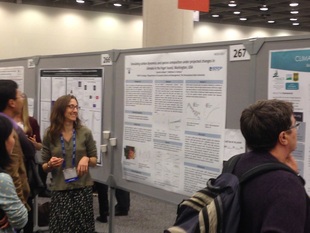 Danelle presented some findings from her investigation into the influence of projected changes in climate on carbon dynamics at Joint Base Lewis McChord in Washington. Her work is part of the SERDP funded project to investigate the effects of forest management on carbon dynamics. Danelle used the LANDIS-II model and downscaled climate projections under a business-as-usual emission scenario and a moderate emission scenario to examine how fluxes of carbon would change over the 21st century. She found that the moderate emission scenario and simulations run using climate data from the latter half of the 20th century produced similar carbon fluxes. The study area remained a carbon sink throughout the simulation period and the decline over time was driven primarily by forest succession and maturation. However, under the business-as-usual scenario, the amount of carbon taken up by the ecosystem declined much more rapidly, especially toward late-century. This result was primarily driven by increased temperature and decreased precipitation during the summer months causing increased water demand by the trees and decreased water availability for growth. 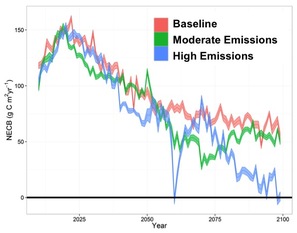 Net Ecosystem Carbon Balance (NECB) captures carbon gains by the system from photosynthesis and carbon losses from the system from respiration and disturbance. This figure shows the mean and standard error of NECB under the three different climate scenarios through late-century.
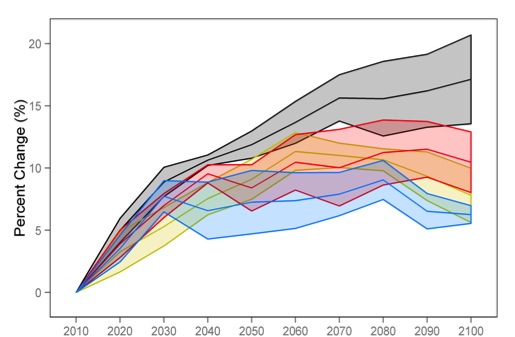
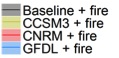
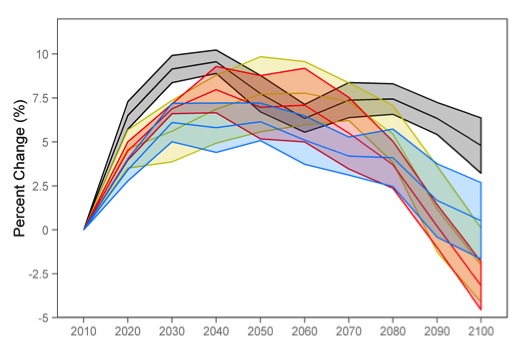
Shuang also used the LANDIS-II model and downscaled climate projections under the business-as-usual scenario. She simulated wildfire using recent distributions of wildfire size and frequency. Two of the common, widely distributed species in the Sierra Nevada are ponderosa pine and white fir. Ponderosa pine is more drought- and fire-tolerant than white fire. She found that relative to simulations with late-19th century climate, the amount of ponderosa pine biomass increased under all three projected climate and wildfire scenarios, while the amount white fir biomass had a small initial increase and the fell below the baseline scenario. This change is indicative of the area of the mountain range a range expansion for ponderosa and a range contraction for white fir. The changes in distribution of the two species is a result of the combined effects of changing climate and wildfire.
Both Shuang and Danelle are pushing forward on their projects, so stay tuned for more results as their research progresses.
|
Archives
October 2023
Categories
All
|
 RSS Feed